
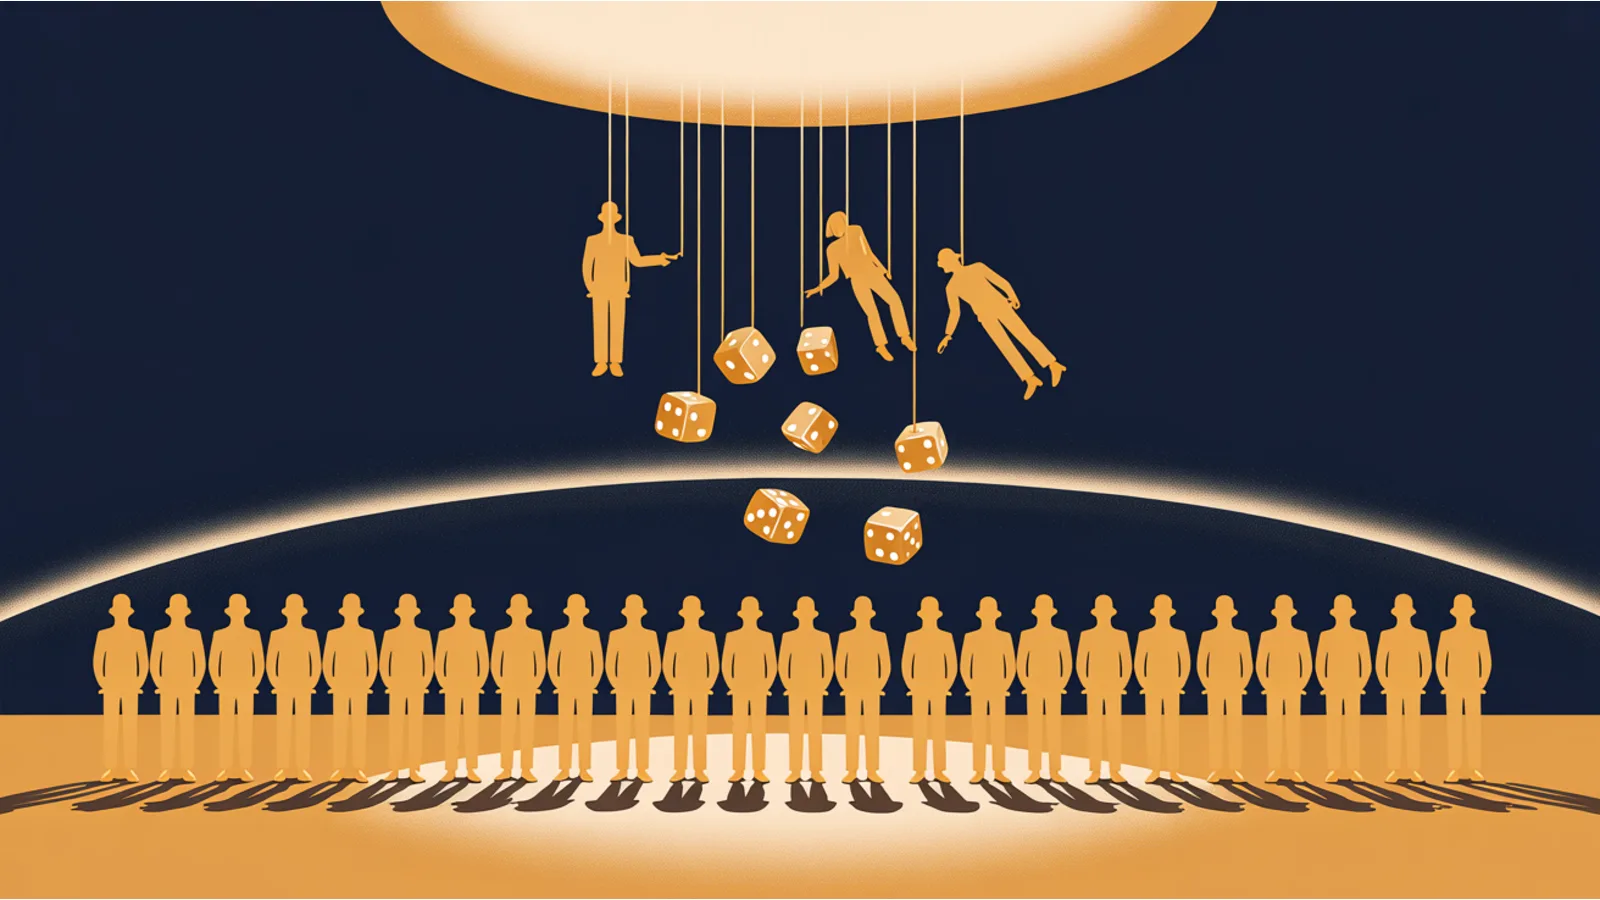
How much of what happens to you is really yours? Three Italian physicists tried to put a number on it, and the honest answer is harder to live with than either side of the effort-versus-luck argument wants to admit. This is the first of a short series. It lays out the evidence that luck runs much of the show. The companion pieces are about what to do with that, since the useful question comes after: given how much luck decides, what are the moves that still tilt the odds?
Start with two numbers about the country I live in.
A child born into the poorest fifth of American households has about a 43 percent chance of still being in that poorest fifth as an adult. That figure comes from Pew's Economic Mobility Project, in a 2012 report called "Pursuing the American Dream" (Pew Charitable Trusts). It gets passed around a lot, often credited to a recent Brookings paper, but the canonical number is Pew's, and it is more than a decade old, not new.
Now the mirror image, and here I have to fix a statistic that circulates in a broken form. You will often read that 70 percent of children born into the top fifth stay in the top fifth. That is not what the data says. The chance of staying in the very top fifth is closer to 40 percent. The 70 percent figure is actually a bottom-end story turned upside down: roughly 70 percent of children raised in the poorest fifth never climb above the middle. Line up the honest versions and the shape still holds. About 43 percent of poor kids stay at the very bottom and most never reach the middle. About 40 percent of rich kids stay at the very top and most never fall below the middle. The floor you start on tends to be the floor you keep.
Neither of those numbers is mostly a story about effort. They are a story about a variable nobody chooses, the family you land in. Daniel Kahneman, who spent a career mapping the mind's blind spots, compressed the whole debate into two lines in Thinking, Fast and Slow: success equals talent plus luck, and great success equals a little more talent plus a lot of luck. Sociologists have a name for the machinery that turns that second line into destiny. Robert Merton called it the Matthew effect, after the line in the Gospel of Matthew, "For unto every one that hath shall be given" (Merton, Science, 1968). Early advantage compounds. The person who gets picked first gets coached more, noticed more, funded more, and pulls away from people who started even. Hold onto that idea, because it runs through everything below, and it decides which of the strategies in the companion pieces actually work.
A hundred identical mice and a lucky first week
In January 2025, Science published a study out of Cornell with a title that tells you the punchline: "Competitive social feedback amplifies the role of early life contingency in male mice" (Zipple et al., Science 387). The researchers released about a hundred genetically identical mice, two-week-old pups and their mothers, into large outdoor enclosures with food and shelter spread evenly, then tracked every movement with RFID tags. Seven and a half million readings over roughly six weeks.
Genetically the mice were the same animal. Their adult lives were not. Early accidents, finding shelter first, winning an early scuffle over a food patch, fed on themselves. A male who got an early edge went on to hold more territory and to encounter something like five times as many females as a low-status male, with no difference in genes or merit to explain it.
Here is the detail the popular retellings drop, and it matters. The divergence happened only in the males. Females in this system do not fight to fence each other out of space, and they stayed roughly equal from start to finish. So the study is not "competition sorts the strong from the weak." It is "an early lucky break, plus an arena where luck can compound, produces a hierarchy out of animals that began identical." Take away either ingredient and the inequality does not appear.
Michael Sheehan, the senior author, said it without hedging (NPR): "Individuals who start succeeding early tend to keep succeeding." Not the most gifted mice. The ones who caught an early break.
The simulation that put a number on it
In 2018, two physicists, Alessandro Pluchino and Andrea Rapisarda, and an economist, Alessio Biondo, built a model to do something nobody had bothered to do: quantify how talent, effort, and luck actually trade off in a career (Pluchino, Biondo and Rapisarda, arXiv:1802.07068, published in Advances in Complex Systems). It is a simple model, and the authors say so plainly. That simplicity is the point.
They created 1,000 agents. Each got a fixed talent score drawn from a bell curve centered at 0.6, on a scale from 0 to 1, which is how talent works in the real world: most people cluster near the middle, a few sit far out on either tail, nobody is infinitely gifted or infinitely useless. Everyone started with the same 10 units of "capital," a stand-in for success, so no one had a head start. Then the model ran a 40-year working life, from age 20 to 60, in six-month steps, 80 steps in all. At each step an agent met either a lucky event or an unlucky one.
The two events are not symmetric, and that asymmetry is the whole engine. An unlucky event simply halves your capital, talent be damned. A lucky event lets you double your capital, but only if you are talented enough to seize it: the model rolls a random number, and you cash in the break only when that number lands under your talent score. So luck arrives without regard to who you are, and talent decides whether you can do anything with it. Luck is necessary. Talent is the thing that converts it.
Run that for forty simulated years and the most talented people do not end up on top. In one run, the single most successful agent finished with 2,560 units, which is the starting 10 doubled eight times. Her talent was 0.61, a hair above the average. Her final pile was 128 times the average capital of everyone in the simulation more talented than she was. Meanwhile the most gifted agent of all, with a talent of 0.89 out of a possible 1, ended with 0.625 units, less than the 10 he started with, because the coin kept coming up the wrong way and the few good breaks he got landed when he had little to double.
The distribution that fell out of this matched the real world eerily well. Twenty percent of the agents ended up holding 80 percent of the capital, the Pareto pattern you find in nearly every economy on earth. The model produced it without giving anyone more ambition, grit, or virtue than anyone else. The only moving parts were a bell curve of talent and a stream of random luck. As the authors put it, "it is evident that the most successful individuals are also the luckiest ones," and, from the abstract, "almost never the most talented people reach the highest peaks of success, being overtaken by mediocre but sensibly luckier individuals."
I want to be honest about what this does and does not prove, because the paper gets waved around as if it settled the question. It did not measure the real economy. It is a toy, and a toy can be rigged. In fact a 2019 follow-up that some of the same authors worked on with Damien Challet showed that if you strip talent out almost entirely, the extreme inequality still shows up (arXiv:1907.04237), because repeatedly multiplying and dividing a stake by chance concentrates wealth at the top all on its own. So read the model as a demonstration, not a measurement. It shows that outcomes which look like pure merit can be manufactured by luck alone. It does not hand you the exact percentage.
What it does hand you, and this is the part people skip, is a strategy. In the same paper the authors tested how to spend a fixed pot of money to produce more successful talented people. Concentrating the funds on whoever was already winning was the worst approach they tried. The best, by a wide margin, was the plainest: hand a small, equal amount to everyone, periodically. That single move lifted the share of talented people who ended up successful from about 32 percent to about 69 percent. The individual version of the same finding is to widen your exposure, meet more people, try more things, seek out variety. That is not my gloss on the paper. It is the paper's own conclusion, and it is one of only two strategies the whole body of research really supports. The companion piece on raising your floor is about both.
The consensus nobody enjoys saying out loud
The simulation is not a lone result. It sits on top of a pile of findings from people who study this for a living.
Tomas Chamorro-Premuzic, a business-psychology professor at University College London and an adjunct at Columbia, summarized that literature in Forbes (2021): "luck comes first, followed by talent, then effort," and then the line that stuck with me, "the more you control something, the less it matters." The thing most inside your grip, your daily effort, moves the outcome least. The thing entirely outside it, where and to whom you were born, moves it most.
He also cites a number that sounds brutal, that intelligence explains only about 15 percent of career success. That is roughly where the research lands, though it deserves a caveat. Meta-analyses of general mental ability and job performance have ranged from about 26 percent of the variance in the older Schmidt and Hunter work down to about 10 percent in a 2022 reanalysis by Sackett and colleagues, who corrected a longstanding statistical over-correction (SIOP summary). So 15 percent is a fair middle, and it climbs for genuinely complex jobs. But the tempting next sentence, that the other 85 percent is luck, does not follow. The rest is spread across conscientiousness, motivation, specific skills, experience, the situation you happen to be standing in, and plain measurement error. Luck is one ingredient in that remainder. It is not the whole thing.
There is a sharper claim worth stating carefully. Jerker Denrell of Oxford's Saïd Business School and Chengwei Liu of Warwick argued in a 2012 paper in the Proceedings of the National Academy of Sciences that the very top performers often should not be imitated or held up as models (Denrell and Liu, PNAS). The careful version of their point is conditional: when performance is extreme, it is more likely to carry a big slug of luck or noise rather than durable skill, so the single highest number in a field is frequently the luckiest sample, not the best one. It is not a blanket "stop rewarding good work." It is a warning about mistaking the top of a noisy ranking for the top of a reliable one.
Eight centuries of the same families
Gregory Clark, an economic historian at UC Davis, went at this from a strange angle. He tracked rare surnames, the kind distinctive enough to follow a bloodline across centuries, through wealth and status records in nine societies, with English data reaching back to 1300 and Swedish data to 1700. His book, The Son Also Rises (Princeton University Press, 2014), lands on a figure that rattled the field: underlying social status persists across generations at a rate of about 0.75, much stickier than the 0.3 to 0.5 that conventional single-generation income studies had reported, and roughly the same whether you look at medieval England, modern Sweden, imperial China, or the United States.
The book opens with a line people love to pull out, "the rich beget the rich, the poor beget the poor." In fairness to Clark, he writes that as the common intuition he is about to test, not as his own slogan. The unsettling part is where his surname evidence ends up: it sides with the intuition. Wealth, it turns out, does not travel between generations only as inheritance. It travels as health, nutrition, confidence, schooling, connections, and the quiet expectation that things tend to work out, an expectation a child absorbs from the room long before anyone hands over money. Poverty travels the same way in reverse, as stress, instability, thin networks, and the weight of scarcity. Those advantages compound across generations exactly the way the lucky and unlucky events compounded across forty years in the simulation. The family you are born into is the first and largest of the coin flips, because it sets the starting position for every flip after it.
The zip code, and a dream that is fading
Raj Chetty's team at Harvard brought this down to the map. Using tax records for millions of children, they showed that the county you grow up in is one of the strongest predictors of what you will earn as an adult, and that the effect is causal, not just a correlation (Opportunity Insights).
The number that usually gets attached to this, a "six times" gap between counties, overstates the cleanest finding. Among the fifty largest metro areas, a child born to bottom-fifth parents has a 4.4 percent chance of reaching the top fifth in Charlotte and a 12.9 percent chance in San Jose, which the authors describe as nearly three times, not six (Chetty et al., QJE 2014). Six is only reachable by comparing the extreme tails of every commuting zone in the country, tiny rural ones included, which is not how the research frames it.
The causal piece is the arresting part. Children who move to a better area pick up roughly 4 percent of that place's advantage for every year of childhood they spend there, which means moving younger captures more of the gain and there is no magic cutoff (Chetty and Hendren, QJE 2018). In the Moving to Opportunity experiment, children whose families used a housing voucher to move to a low-poverty neighborhood before age 13 went on to earn 31 percent more as adults, a projected lifetime gain of about $302,000 per child (Chetty, Hendren and Katz, AER 2016). Same kids. Different dirt under their feet.
And the ladder itself is getting shorter. In a separate paper, "The Fading American Dream," Chetty and colleagues measured absolute mobility, the plain question of whether you out-earn your own parents. For children born in 1940, about 90 percent did. For children born in the 1980s, only about 50 percent did (Chetty et al., Science 2017). A coin flip, where two generations earlier it was closer to a sure thing. The driver was not slower growth so much as growth that flowed to fewer people. The game did not just stay rigged. The prize for playing it well got smaller.
What the hard-work camp gets right
The research does not say what people assume it says. It does not say talent and effort are irrelevant. Set talent to zero in the simulation and the agents cannot exploit a single lucky break. Talent is the mechanism that turns luck into a result. It just never produces the luck.
Effort is real too, inside limits the evidence keeps tightening. The 10,000-hours idea, that enough deliberate practice makes an expert, took a hard knock from a 2014 meta-analysis by Macnamara and colleagues (Psychological Science). Practice explained about 26 percent of the difference in performance in games, 21 percent in music, 18 percent in sports, 4 percent in education, and less than 1 percent in professions. Real, and a long way short of the slogan. Grit had a similar reckoning. A 2017 meta-analysis of nearly 67,000 people found that grit predicts performance only weakly and overlaps so heavily with ordinary conscientiousness that it may be an old trait wearing a new name (Credé, Tynan and Harms).
The same fate met the most famous willpower study of all, the marshmallow test. In the original 1960s experiment, small children who could hold out for a second treat later showed better teenage outcomes, and the result hardened into a parable about self-control. Then a 2018 replication on a much larger and more representative sample found the effect was about half the original size and shrank by roughly two-thirds once you controlled for the child's family background and home environment (Watts, Duncan and Quan, Psychological Science). A companion study had already shown why: children who had just watched an adult break a promise waited a fraction as long, because when your world has proven unreliable, eating the treat now is the rational move (Kidd et al., 2013). The capacity to wait, it turned out, was in large part a read on how stable and trustworthy a child's circumstances had been. The willpower was real, and small, and mostly a proxy for the luck of the home you were born into.
Carol Dweck's growth mindset belongs in the same honest frame. The core idea, that believing ability can grow changes how you handle setbacks, holds up, and a 2025 study of Chinese employees found that a growth mindset about yourself and about your work both tracked with more resilience and better wellbeing, with the self-focused version doing the heavier lifting (Siu et al., Stress and Health). But Dweck herself has spent years cooling the hype. The effect of a typical mindset program on a struggling student's grades is about a tenth of a grade point, real but small, and she is blunt that nobody runs on a pure growth or a pure fixed mindset (Dweck and Yeager, 2019). We slide between them by the day and the domain.
So the honest synthesis is not "fate wins." It is closer to this. Talent, effort, and mindset are the preconditions. They decide whether you can catch a lucky break when one flies past. They do not decide whether one flies past, or when, or how many. Pretend either half is doing all the work and you have the story wrong.
Two biases that keep the lie comfortable
There is a reason this is hard to say honestly, and it lives inside all of us.
When successful people tell their own story, they reliably shave down the luck and inflate the agency. Psychologists named this in 1975 and it has held up ever since: the self-serving attribution bias, the habit of crediting our wins to our character and blaming our losses on circumstance (Miller and Ross). It runs both directions. Winners take more credit than they earned. People who lost often take more blame than they deserve. Both feel true from the inside. Both are, on average, wrong.
The economist Robert Frank has a sharper way of putting it. In Success and Luck he describes an asymmetry of attention (Princeton University Press, 2016). When you bike into a headwind you feel every yard of the struggle, but when the wind swings around to your back you enjoy a moment of relief and then forget it is there. Advantages work like tailwinds. We notice the obstacles we fight and stay blind to the pushes we get, which is exactly why the people with the most help tell the most convincing stories about doing it alone.
Survivorship bias does the rest of the damage. The cleanest illustration comes from World War II. The military wanted to armor the bombers coming back from raids, and the returning planes were shot up across the wings and fuselage, so that is where the brass wanted the plating. The statistician Abraham Wald spotted the flaw. The data only contained planes that made it home. The spots where those survivors were hit were, by definition, the spots a plane could take fire and still fly. The armor belonged where the returning planes were untouched, the engines, because the planes hit there were the ones that never came back (survivorship bias). We do the same thing with people. We study the ones who made it, copy their morning routines and their reading lists, and never see the equally hardworking, equally talented people who did all of it the same and caught the bullet in the engine. That blind spot matters enormously the moment you start choosing which path to chase.
Five things that actually shape a life
Pulling the research together, here is the most honest ranking I can build of what moves a human outcome.
Birth circumstances come first. The family, country, era, and class you are born into set the starting conditions for everything after, and you had no vote. Branko Milanovic, who studies global inequality, estimates that the country you live in alone accounts for 50 to 60 percent of the variation in individual income worldwide (Milanovic, 2015). Add the income of your parents and you are up near two-thirds. Add every other circumstance you did not choose and it climbs past 80 percent.
Early luck comes second. The mouse study, the simulation, and decades of sociology agree that early good breaks compound in ways detached from merit. A teacher who saw something in you. A mentor who picked you. An economic boom that happened to line up with your first job. Outside your control, and enormous.
Talent comes third. Intelligence, creativity, social skill, and specific ability decide how well you convert opportunity into a durable result. They explain something in the range of 10 to 26 percent of performance depending on the field, and they are themselves partly a product of genes and environment, both of which are their own kind of luck.
Mindset and effort come fourth. This is the piece most inside your control and the one success culture shouts about loudest. The research says it matters. It also says it matters less than the three things above it.
Timing and structure come fifth. The moment in history, the industry cycle, the policy weather, and the social machinery around you when your talent and effort go to work all decide how much those inputs pay out. A founder who would have been a billionaire in 2009 Silicon Valley might have run a decent small business in another decade or another country.
What to do with all this
None of this is a case for giving up. The simulation is very clear that without talent and preparation, a lucky break produces nothing at all. And the fact that luck sets the distribution of opportunities does not mean you have no say in how exposed you are to it. That is the whole subject of the companion pieces, and it comes down to two moves the research actually supports: widen your exposure so more chances fly past you, and climb a structured ladder that raises your floor so a bad break cannot ruin you. The rest of this series is about how people do both, who gets access to the structures that make it easy, and what happens when those structures are gamed.
For now, hold one idea. When a break finally lands, remember it was not entirely your doing. When it doesn't, remember it was not entirely your failing. The luck was never yours to summon. What you do with it is the only part that was ever really yours.
Read next
- Luck, Ladders, and Tolls: the complete series, all seven parts in one place
- Raise your floor: the ladders that trade the jackpot for a reliable outcome
- Legal edges and lotteries: the paths gated by who you are
- When the floor-raisers get looted: the fraud inside the structures
- The W2 trap and the toll economy: why wages are the one input with no guaranteed return
- The working ledgers: the whole map of how money actually moves
Fact-check notes and sources
Every figure here was checked against a primary source, and several widely repeated claims were corrected rather than smoothed over.
- Mobility: the 43 percent bottom-quintile persistence figure is Pew's Economic Mobility Project, "Pursuing the American Dream" (2012), not a recent Brookings paper; the "70 percent stay in the top fifth" claim is wrong (real top-quintile persistence is about 40 percent, and 70 percent is the share of bottom-raised children who never rise above the middle). Pew
- Birthplace: country of residence accounts for 50 to 60 percent of global income variation. Milanovic, 2015
- Merton, "The Matthew Effect in Science," Science 159 (1968), from Matthew 25:29. Kahneman, Thinking, Fast and Slow (2011), ch. 17.
- Cornell mouse study: Zipple et al., Science 387 (Jan 3, 2025). The mice were genetically identical; the compounding-luck effect appeared in males only; the Sheehan quote is verbatim. Science
- The simulation: Pluchino, Biondo and Rapisarda, "Talent vs Luck," Advances in Complex Systems 21 (2018), arXiv:1802.07068; the winning agent's talent was 0.61, the 2,560 figure is a single-run maximum, both quotes verified. Toy-model caveat: arXiv:1907.04237.
- The consensus: Chamorro-Premuzic is at University College London and Columbia, not "Columbia Business School" (Forbes); general mental ability explains roughly 10 to 26 percent of job-performance variance (Sackett et al. 2022); Denrell and Liu, PNAS 109 (2012), state a conditional claim.
- Clark, The Son Also Rises (Princeton, 2014), persistence about 0.75; the "rich beget the rich" line is Clark framing the conventional belief he then tests. Chetty: the county mobility gap is about threefold (Charlotte 4.4 percent, San Jose 12.9 percent), not "six times"; the Moving to Opportunity gain was 31 percent and about $302,000 in lifetime earnings; "The Fading American Dream," Science 356 (2017), 90 percent to about 50 percent.
- Effort research: deliberate practice (Macnamara et al., Psychological Science, 2014); grit (Credé et al., JPSP, 2017); the marshmallow effect is real but small and largely explained by circumstance, not "debunked" (Watts, Duncan and Quan, 2018; Kidd et al., 2013); growth mindset (Siu et al., 2025; Dweck and Yeager, 2019).
- Biases: self-serving attribution (Miller and Ross, 1975); the Wald bomber-armor story is the popular retelling of a correct logic; Robert Frank's tailwinds/headwinds (Success and Luck, 2016).
This piece is informational, not financial or career advice. Mentions of third parties are nominative fair use, and no affiliation is implied.
