Most review audits read like a balance sheet. "You have 87 reviews and an average of 4.6 stars."
That's the photograph. The thing you need is the film.
Reviews aren't a snapshot number. They're a flow. Three flow signals matter more than the current total:
- Velocity — reviews per month.
- Sentiment — the tone of recent reviews, independent of stars.
- Star-rating trend — whether the rolling 3-month average is rising, stable, or falling.
All three can be healthy while the balance-sheet number looks fine. All three can be failing while the balance-sheet number still looks fine. The difference becomes visible 30-60 days later when local-pack visibility drops and you can't explain why.
The mechanism
Google's local-pack algorithm weights recent reviews more than historical ones. If your 87 reviews average 4.6 stars but your last 12 reviews average 4.1 stars, Google's ranking signal degrades even though your public-facing average hasn't moved much yet.
Three flow patterns matter specifically:
Velocity drop. Going from 5 reviews/month to 2 reviews/month signals that your review-solicitation motion is broken. Maybe your post-service email stopped sending. Maybe the team stopped asking in person. Maybe Google's spam filter flagged a chunk of your solicitations. Whatever the cause, fewer reviews = weaker prominence signal.
Sentiment drift with stable stars. Star ratings lag sentiment. Customers give you 4 stars while writing increasingly negative prose ("it was fine but"). The stars-to-sentiment gap is a leading indicator — usually 1-2 months ahead of the star rating itself dropping.
Star-rating trend declining. The slowest but most consequential. Going from 4.8 to 4.4 over 12 months is a structural problem — something in the business delivery has degraded, and customers are documenting it at the rate of one star-drop per quarter.
What the Review Velocity + Sentiment Trend does
You paste review data as YYYY-MM-DD | stars | review text, one per line. The tool:
- Parses and buckets reviews by month.
- Computes per-month velocity (count), average stars, and a lexical sentiment score (~70-word positive/negative wordlist).
- Computes overall trend slopes for velocity, stars, and sentiment using simple linear regression.
- Compares last-3-months vs prior-3-months to surface velocity-Δ and stars-Δ.
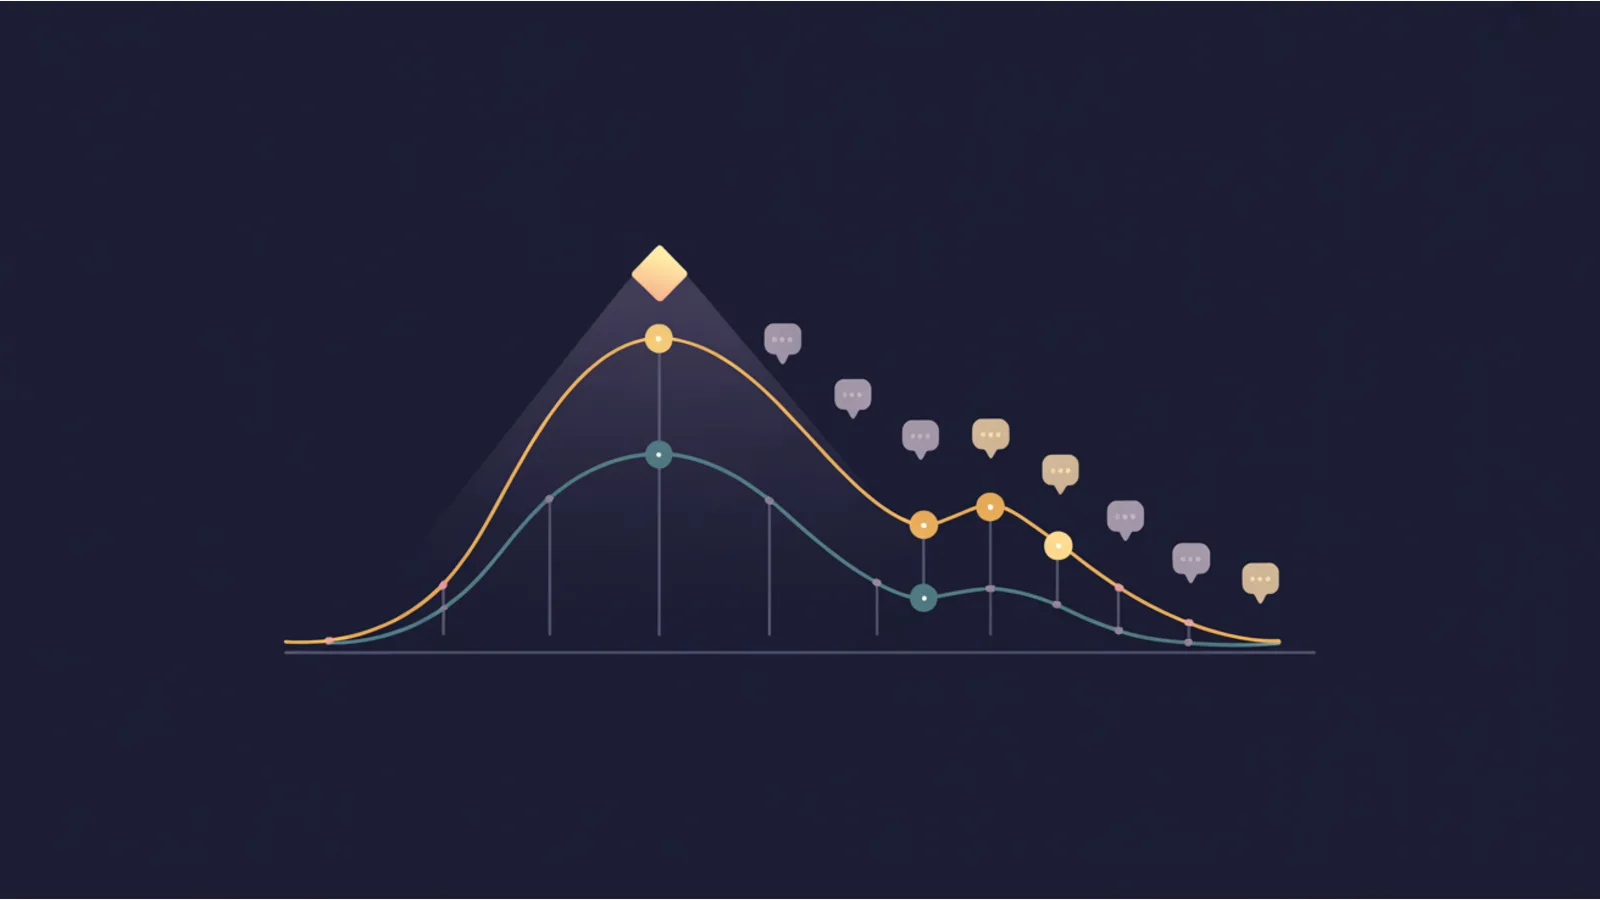
- Renders a chart with velocity bars + sentiment line overlaid.
- Fires three specific alerts when thresholds trip:
- Velocity drop > 25%
- Star drop > 0.15
- Sentiment slope < -0.5
- Emits an AI fix prompt that diagnoses which flow is broken and proposes the specific intervention.
Reading the three alert patterns
Velocity alert only — your review-solicitation motion is broken, nothing about the product is wrong. Fix: audit post-service follow-up (email, SMS, QR code at checkout), reduce friction (shorter ask, direct Google link), set a team target.
Sentiment alert only — customers are still showing up but are grumpier. The operational problem is specific and probably identifiable in the review text. Read the last 20 reviews in chronological order; the common theme is usually visible in the fourth or fifth review.
Stars alert only — the business delivery has degraded. A specific service line or a specific employee is the likely cause. The AI fix prompt's #5 job is to surface this pattern.
Multiple alerts firing — compound problem. Don't try to fix all three at once; fix the stars alert first (operational), because without that, velocity and sentiment won't recover.
The 60-day response plan
Week 1-2: Identify the cause from review text. Read everything from the last 90 days in chronological order. Look for the first negative review that broke the pattern and what it mentions.
Week 3-4: Fix the operational issue. Usually a single employee, a specific service line, a scheduling problem, or a communication gap.
Week 5-6: Re-prime the solicitation motion. Every completed job gets a direct ask. Text or email with a single-tap Google-review link. Target 1 review per 5 completed jobs.
Week 7-8: Re-run this audit. The velocity curve should be rising, the sentiment should be stable or improving, the star trend should be flat at minimum.
At day 60 you'll have two fresh months of positive data weighting against the earlier drift. Google's local pack usually reflects the recovery within another 30 days.
When the audit says "all stable"
If the tool reports all trends stable or improving, that's information too. Don't assume you're safe and stop monitoring — drift starts gradually. The useful signal when stable is: your current cadence is working, don't change anything.
Related reading
- GBP Review Audit — point-in-time review inventory (companion)
- Competitor GBP Change Detector — watch competitors' review velocity too
- GBP Q&A Staleness Audit — Q&A is a separate prominence signal neglected the same way
- Local Pack Triangulation — measure the downstream visibility before and after recovery
Fact-check notes and sources
- Google local-ranking prominence signals (including reviews): Google Business Profile Help — How Google ranks local results
- Review-recency weighting: convergent industry observation (Moz Local Search Ranking Factors reports, BrightLocal annual studies)
- Lag between sentiment drift and star-rating drop: typical 30-60 day pattern based on SMB review cohorts
This post is informational, not reputation-management-consulting advice. Mentions of ReviewTrackers, GatherUp, Podium, BirdEye, BrightLocal, and Moz Local are nominative fair use. No affiliation is implied.
