A restaurant owner in Twin Falls checked "pizza twin falls" from inside her restaurant and saw herself ranked #1. She told the marketing agency they were wasting her money — she was already winning.
Three miles east, on the edge of her delivery radius, her competitor showed at #1 and she was #7. A customer in that part of town never saw her name in the local pack.
She had been paying for delivery ads to solve the problem. Delivery ads don't fix local rank. She needed to know she was invisible three miles east, and she needed a map showing it.
Why proximity wins and loses
Google's local pack algorithm weights proximity more heavily than any other factor for queries with local intent. The ranking function is (approximately):
- Relevance to the query
- Proximity of the business to the searcher
- Prominence (reviews, links, citations, brand strength)
Proximity usually dominates the top three results within a 1-mile radius. Outside that radius, relevance and prominence start to matter more. This means your rank is a function of WHERE the search happens, not just WHAT was searched.
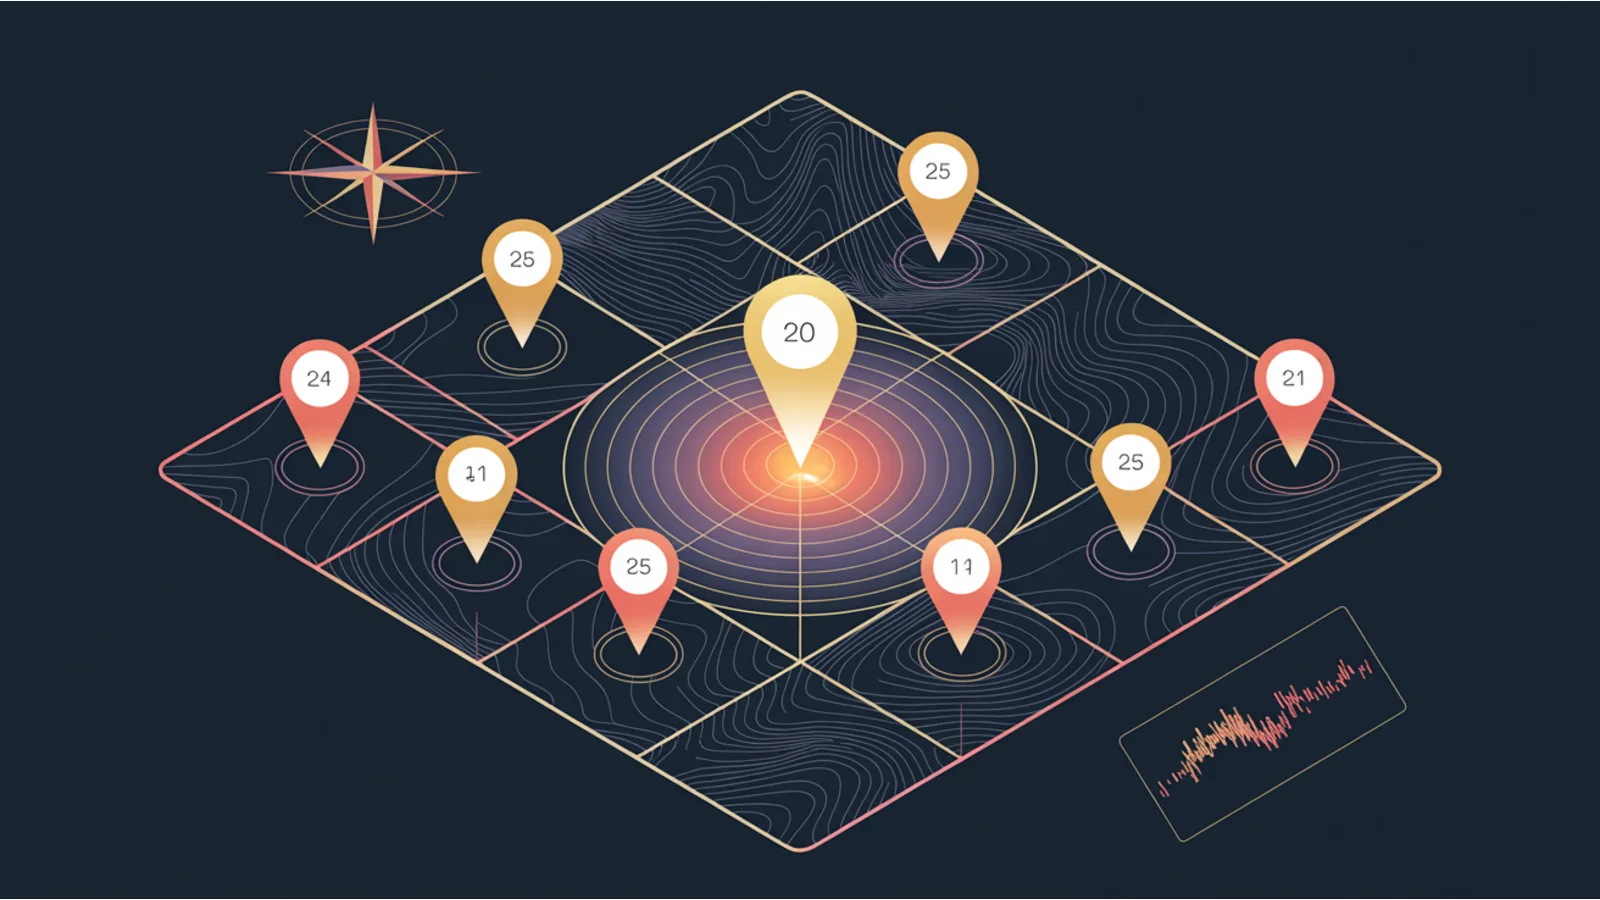
A grid of 25 geo-points around your service area will show you three things a single rank check can't:
-
The proximity bubble — how far your top-3 dominance extends. A tight bubble (only within 1 mile) means you're winning on location alone. A wider bubble (5+ miles) means you have genuine relevance + prominence signals propagating beyond proximity.
-
Directional bias — whether a competitor dominates a specific quadrant. A rank of 1 at your address but rank 12 to the east suggests a competitor to the east is picking up proximity + prominence relative to you in that quadrant.
-
Coverage gaps — which parts of your service area show you outside the top 10. These are the ZIPs where your ads are working harder than they should because organic isn't picking up the slack.
What the Local Pack Triangulation tool does
It simulates Local Falcon's grid approach without violating Google's TOS (which is why paid tools charge $24/mo — they're licensing or scraping geo-spoofed rank data).
You set:
- Center latitude and longitude of your business
- Grid size: 3×3 (9 points), 5×5 (25 points), or 7×7 (49 points)
- Spacing in miles per step
The tool generates a grid of geo-points with a per-cell "Open in Maps" link. You click each link in a new tab, the Maps page opens centered at that geo-point, you do the search, note your rank, and type it into the cell.
It's not automated. That's a feature. Google explicitly forbids automated geo-spoofed rank checking in their TOS. Paid tools either (a) license the data from Google (rare, expensive) or (b) violate the TOS and hope they don't get cut off. We prefer the honest manual path — especially since 25 cells takes about 15 minutes and you do it monthly.
Reading the heatmap
A tight green bubble at center — your proximity signal is strong within ~1 mile. If the bubble extends to 3+ miles, your prominence (reviews, citations, links) is pulling you above competitors on proximity loss. That's ideal.
A bubble that doesn't reach center — your center cell shows rank 6+ while outer cells show 1-3. This means a competitor closer to center is stealing proximity. Usually fixable via NAP fix (you're at the wrong address in your GBP) or a genuinely closer competitor has overtaken you.
Directional gradient (north strong, south weak) — a specific competitor dominates the south. The tool flags this automatically and names the direction. Response: audit the southern area — does a competitor have a physical presence, a dedicated service-area page, inbound local links from businesses in that area?
Red ring with a green center — you win at your address and lose everywhere else. Pure proximity play. Fix: expand prominence (reviews, citations, local link-building) so proximity matters less.
The 30-day fix cycle
Week 1: Run the triangulation. Note the worst quadrant. Week 2: Publish a ZIP-specific service-area page for the worst quadrant. Include hyperlocal landmarks, neighborhood names, and 300+ words of genuine service description for that area. Week 3: Request reviews from customers in that quadrant. "Can you mention you're in [neighborhood] in your review?" works. Week 4: Re-run the triangulation. Compare to week 1.
At 30 days most sites see a 2-3 position improvement in the worst quadrant. 60 days is where the real gains show up.
Related reading
- NAP Consistency Auditor — upstream check; an inconsistent NAP torpedoes every local strategy
- Google Business Profile Competitor Audit — benchmarks the competitor your grid reveals
- Local Citation Coverage — directory presence affects prominence
- Service Area Schema Coverage — once you have a grid, make sure every area in your schema has a landing page
Methodology: the proximity/relevance/prominence framework is the canonical Google local-ranking model from their official documentation. The grid-sampling approach was popularized by Local Falcon; this tool reimplements the manual variant to stay compliant with Google's automated-query prohibition.
Fact-check notes and sources
- Google local-ranking factors: Google Business Profile Help — How Google ranks local results
- Google TOS on automated queries: google.com/intl/en/policies/terms/
- Local Falcon methodology disclosure: localfalcon.com (they run crawlers with geo-IP spoofing, which is why they charge)
This post is informational, not SEO-consulting advice. Mentions of Local Falcon, BrightLocal, PlacesScout, and SEMrush are nominative fair use. No affiliation is implied.
