
Twenty-fifth in a series on jobs whose pay system is stranger than the salary. This one belongs with the other tollbooths, the workers who skim a slice of money as it moves rather than producing the money themselves: insurance agents, mortgage brokers, and the people who sell mortgage bonds. A financial advisor is the purest of them, because the toll is charged on the client's entire balance, every year, forever. Every figure below is cited to the Bureau of Labor Statistics, the SEC, FINRA, the CFP Board, or an industry survey, and where a number could not be verified at a primary source I say so rather than estimating.
Almost every job in this series is paid for something. Longshoremen are paid for hours, even the ones they do not work. Harbor pilots are paid for a scarce license. Firefighters are paid for a redefined week.
A financial advisor is paid for money that is merely passing through.
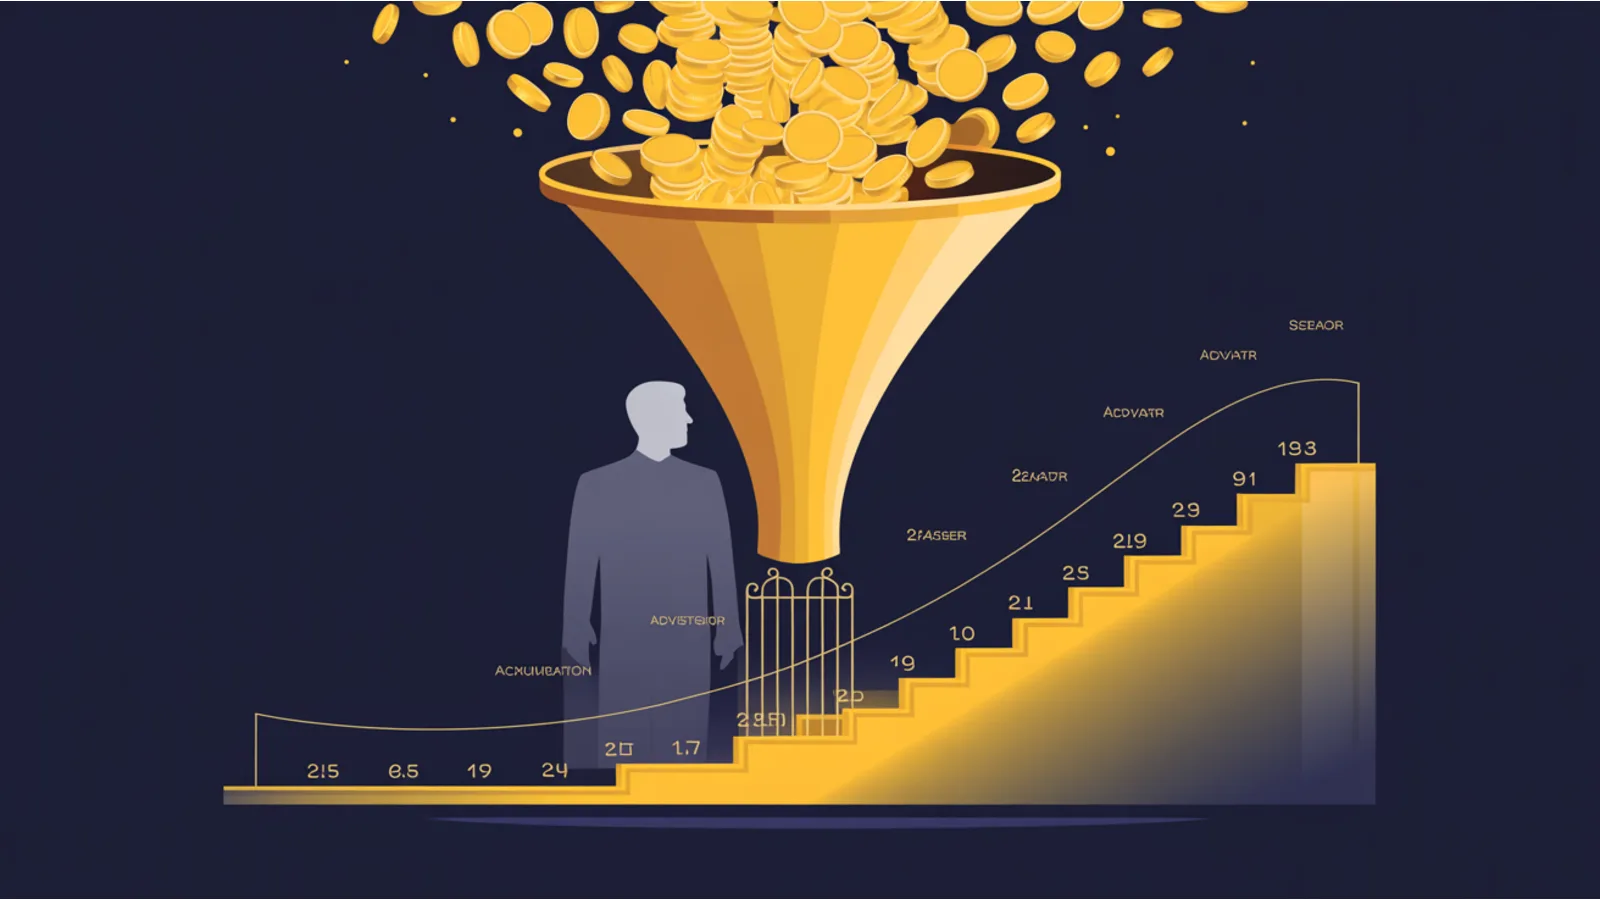
The signature charge, the assets-under-management fee, is roughly 1% a year levied on the whole balance in the account. Not 1% of the gains. Not 1% of the money the advisor brought in. One percent of everything the client owns in the account, charged every year, whether the market went up or down and whether the advisor did anything that year at all. It is a tollbooth bolted to a river of somebody else's capital, and the toll is collected on the full flow as it moves past, in the good years and the bad ones alike.
That is why the wage survey badly understates the economics of the job, and why the rest of this article is really about a percentage sign.
The survey number, and why it is the least interesting number here
The Bureau of Labor Statistics reports a median annual wage for personal financial advisors of $102,140 in May 2024, which is $49.11 an hour. Against a median of $49,500 for all workers, that is a good living, roughly double the typical American wage. The distribution stretches wide: the lowest tenth earned less than $49,990, and the highest tenth earned more than $239,200.
Hold that top figure for a second, because it is top-coded. BLS does not report a ceiling above "more than $239,200," which means the survey simply stops measuring where the interesting money begins. About 326,000 people held the job in 2024, a count BLS projects to grow 10%, much faster than average, to 357,200 by 2034, with roughly 24,100 openings a year. Sixty percent of them work in one industry the government labels "securities, commodity contracts, and other financial investments and related activities."
Here is why the median is a decoy. BLS itself says advisors "either charge a flat fee or earn commissions for the financial products that they sell." Both of those are wage-like. Neither is the AUM fee, which is not really a fee for services at all. It is a percentage of a growing pool of assets, and the advisors at the top of this profession are not paid a salary in any recognizable sense. They keep a slice of a river. A salary tops out. A slice of a river does not, because the river keeps getting wider as the client's money compounds. That is the whole reason the 90th percentile is a censored figure rather than a real ceiling.
The toll, drawn to scale
The number that matters is 1%, and the reason it matters is that it is charged the same way the client's returns are earned: on the whole compounding balance, year after year.
The SEC's Office of Investor Education and Advocacy published a short investor bulletin, "How Fees and Expenses Affect Your Investment Portfolio," that makes the point with the cleanest possible example. Take a $100,000 portfolio earning 4% a year over 20 years, and run it three times, with ongoing fees of 0.25%, 0.50%, and 1%. The bulletin's own sentence explains why the fee does more damage than its size suggests: "Because of the fees you pay, you have a smaller amount invested that is earning a return."
Read that slowly. The fee is not just a slice off the top. It is a slice off the top that then does not compound for you. Every dollar the toll collects this year is a dollar that will not earn a return for you next year, or the year after, for the entire remaining life of the account.
The SEC's chart carries the widely quoted takeaway that a 1% annual fee, over that 20-year run, reduces the ending portfolio by nearly $30,000 compared with a 0.25% fee. I have to flag the provenance honestly, the way this series always does. The bulletin's inputs, the $100,000, the 4%, the 20 years, and the three fee levels, I confirmed in the PDF text. The precise "$30,000" label sits inside an image in the chart, which I could not read as text, so treat that dollar figure as the SEC's own chart takeaway reported through its surrounding text rather than a number I could read straight off the chart. And the broader claim you will hear everywhere, that a 1% fee eats a "large share of lifetime returns," is an extrapolation from that 20-year example. The SEC bulletin does not state a lifetime percentage, so I am not asserting one. The mechanism is verified. The exact lifetime bite would have to be computed for each client's horizon.
But sit with what the SEC did confirm. Three quarters of a percent of difference in the annual fee, on a middling portfolio, over a single working lifetime's worth of years, is worth tens of thousands of dollars, and it goes to the tollbooth.
What the toll actually runs, and what sits underneath it
The industry's most-cited fee research comes from Michael Kitces and the surveys run by Bob Veres, covering on the order of 1,000 advisors. It is industry research, not a regulator, so treat it as informed secondary data rather than a government figure. But it maps the toll better than anything a regulator publishes.
The median AUM fee is 1% on portfolios up to $1 million, and it steps down on a graduated schedule as the balance grows: about 0.85% above $1 million, 0.75% above $2 million, 0.65% above $3 million, and 0.50% above $5 million. Below $250,000, the median actually climbs toward 1.25%. So the toll is regressive at the bottom and gently discounted at the top, which is exactly what you would expect from a charge levied on a flow: the biggest flows negotiate a thinner slice, and even a thinner slice of a huge river is an enormous number.
The 1% is not the whole cost, either. Kitces puts the all-in cost, the advisory fee plus the underlying fund expense ratios plus the platform fees, at roughly 1.85% under $250,000, about 1.65% up to $1 million, and around 1.20% over $5 million, with the underlying product and platform layer holding steady around 0.60% to 0.70% no matter what. In other words, on a typical account, close to two thirds of a percent is being skimmed by layers the client may never see, underneath the advisory toll they were quoted. And the AUM model has swallowed the profession: the large majority of advisors now use assets under management as their primary pricing basis, a shift Kitces pricing research documents, though the exact adoption percentages sometimes quoted come from a different Kitces study than the fee-schedule data above and are not on the page cited here.
This is the tell. When the overwhelming majority of a profession prices itself as a percentage of assets rather than a fee for hours or a fee for a plan, the profession has decided, collectively, to be a tollbooth rather than a workshop.
The older toll: commissions skimmed on the way in and on the way past
Before the AUM fee took over, the money reached the advisor a different way, and that older machinery is still running underneath a large part of the industry. It is worth understanding because it is a toll too, just collected at a different point in the flow.
A mutual fund can carry a front-end sales load, a commission charged the moment you buy in. Under FINRA Rule 2341, that load is capped at 8.5% of the amount invested. Read what that does: on a $10,000 purchase, as much as $850 can come off the top before a single dollar is invested, which means, in the SEC's framing from earlier, you start with a smaller amount earning a return. The load is a toll at the gate.
Then there is the toll that keeps collecting after you are through the gate. The 12b-1 fee is an annual asset-based charge paid out of the fund's own assets, named for Section 12b-1 of the Investment Company Act of 1940. Under FINRA rules it is limited to 1.00% a year, split as 0.75% for distribution and 0.25% for shareholder servicing. That servicing slice is the "trail," the ongoing commission that compensates the broker year after year for a sale made once. It is the same shape as the AUM fee, a small annual percentage on the whole balance, arriving whether or not anyone does anything.
I confirmed the 8.5% load cap and the 1.00% 12b-1 cap from FINRA's rule summaries rather than reading the rule text line by line, so treat those two caps as well-sourced secondary figures. And an honest caveat: these are ceilings, not typical charges. Loads vary enormously by fund and share class, and a great many funds now charge far less or nothing at all. Index funds broke the front-end load the way the internet broke a lot of tollbooths. But where the old commission model survives, it survives as a toll.
The legal fork that decides which toll you pay
Here is the part that determines, more than anything else, how the money reaches the person advising you: whether they are legally an "adviser" or a "broker." The two words sound interchangeable. In law they are not, and the difference is a difference in how they are paid.
An investment adviser is a fiduciary under the Investment Advisers Act of 1940. The SEC's 2019 interpretation frames the duty as a duty of care and a duty of loyalty, and advisers are typically paid the ongoing asset-based fee, the 1% toll. A broker-dealer representative is held to a different standard, Regulation Best Interest, which the SEC adopted on June 5, 2019, with a compliance date of June 30, 2020. Reg BI requires the broker to act in the retail customer's best interest at the time of a recommendation, but it does not impose a continuous fiduciary duty, and brokers are typically paid transaction-based commissions, the loads and trails from the section above. Both must hand you a plain-language relationship summary called Form CRS; advisers additionally file Form ADV. I drew this framing from summaries of the SEC's final Reg BI release and the adviser-conduct interpretation rather than quoting the primary PDFs in full, so treat the legal characterization as carefully-sourced secondary rather than verbatim.
Strip away the acronyms and the fork is simple. One side is paid a percentage of your balance for as long as you hold it. The other side is paid a commission each time something is bought or sold. The first is a toll on money at rest. The second is a toll on money in motion. Neither is a wage for hours, and the legal category quietly tells you which tollbooth you are standing at.
The credentials, which are gates on the toll booth
You cannot collect this toll without passing through some exams, and the exams are the scarcity mechanism that keeps the profession from being flooded. This series always finds one. Here it is a set of standardized tests.
The exam that lets you register as an investment adviser representative is the Series 65, officially the NASAA Investment Advisers Law Examination, administered by FINRA. It runs 130 questions in 180 minutes, and you need 92 correct to pass. That is the fee-side gate. On the brokerage side, the Series 7, the General Securities Representative exam, lets a representative sell most securities, and the Series 63, the Uniform Securities Agent State Law exam, covers state law for broker reps. For someone who already holds a Series 7, the Series 66 combines the 63 and the 65 into one exam. I read the Series 65 details at FINRA directly; the Series 7, 63, and 66 descriptions I took from FINRA and NASAA exam summaries in search, so treat those as secondary.
The bigger gate is the CFP mark, the certification most associated with genuine financial planning. The CFP Board requires what it calls the "four E's." Education is a bachelor's degree in any field plus CFP Board-registered coursework. Examination is a 170-question exam given over two 3-hour sessions in a single day, with a first-time pass rate the Board has cited around 67% for 2019. Experience is 6,000 hours of professional financial-planning work, or 4,000 hours through an apprenticeship. And Ethics requires the candidate to commit, in the Board's own words, to "act as a fiduciary when providing financial advice to your client, always putting their best interests first." I confirmed the four E's at cfp.net.
Notice what the CFP gate does. It is real, it is demanding, and it takes years of experience to clear. And it is also, functionally, the thing that lets its holder charge the toll with a straight face. The scarcity of the credential is what makes the percentage defensible.
How the money reaches a person inside a big firm
Most people picture a financial advisor as a solo professional. A large share of the visible ones work inside a "wirehouse," one of the big brokerage firms, and inside those firms the pay runs on a device with no salary in it at all: the grid.
An advisor on a grid does not earn a wage. They generate revenue, the fees and commissions their book of clients throws off, and they keep a percentage of it. The percentage is set by a schedule, the grid, that pays out more as the advisor produces more. As a rough industry generalization, trade press describes advisors taking home somewhere in the range of 35 to 45 cents of every revenue dollar, though that broad figure is not tied to any single published grid. For 2026, Merrill Lynch's standard grid is reported to run 34% to 51% on accounts above $500,000, with a reduced 20% rate on smaller households between $250,000 and $500,000, and Morgan Stanley is reported to have raised its own small-household threshold to $300,000.
Two honest caveats. These figures come from trade publications such as InvestmentNews and AdvisorHub, not from a regulator or a published schedule, so present them as ranges and as reporting rather than fixed fact. And they change every single year, by firm and by production tier, and they sit on top of deferred-compensation and bonus arrangements that shift constantly and are not publicly fixed. What does not change is the structure: the advisor is a toll collector who keeps a cut of the tolls, and the firm keeps the rest for providing the booth, the brand, and the compliance department. The client's balance is the flow both of them are drinking from.
The three ways to be paid, and what each one is a toll on
Strip the whole profession down and there are three compensation structures, and the useful way to see them is by asking what, exactly, each one takes its slice from.
Fee-only advisors are paid solely by the client. That can be the AUM percentage, a flat annual retainer, or an hourly rate. The AUM version is the pure toll on money in motion: charged on the whole balance annually, regardless of activity, regardless of performance. The retainer and hourly versions are the closest this profession comes to an honest wage, because they are priced to the work rather than to the flow.
Commission-based representatives are paid by the product sponsors, through the loads and 12b-1 trails from earlier. Their toll is collected on the transaction and on the product, not billed to the client as a visible fee, which is precisely what makes it easy to miss.
Fee-based, or hybrid, advisors do both. They charge the client a fee and also collect product commissions. This is the structure the fiduciary purists distrust most, because the two revenue streams can point in different directions. I have drawn this taxonomy from the combined framing of BLS, the SEC, FINRA, and the Kitces data, all cited below, plus the investor.gov explainer on fees.
The reason to learn the three names is defensive. When you ask an advisor how they are paid, you are really asking which flow they are taking a slice from, and whether that slice grows when your balance grows, when a product is sold, or only when they actually do work for you.
What a salaried reader should take from this
The most expensive number in your financial life may be a percentage, not a price. A salaried worker is trained to compare prices, the sticker on the thing you buy. The AUM fee is not a price, it is a percentage of a compounding balance, and the SEC's own example shows three quarters of a percent turning into tens of thousands of dollars over 20 years, because every dollar the toll takes is a dollar that stops compounding for you. When something is billed as "just 1%," the question is 1% of what, how often, and for how many years, because a small slice of a large, growing, long-lived flow is an enormous absolute number.
A charge levied on a flow is not the same as a charge for work. The strangeness at the center of this job is that the biggest earners are not paid for labor. They are paid a fraction of money that is passing through their care, and that fraction arrives in the years they work hard, the years they coast, and the years the market falls and the client loses money. This is the shared DNA of the whole toll cluster in this series, from insurance agents collecting on renewals to mortgage brokers skimming the loan as it closes. The tell, in every case, is that the pay is indexed to the size of a flow the worker did not create.
Ask which legal category, because it tells you which pocket the money leaves. Adviser or broker, fee or commission, fiduciary duty or best-interest standard, these are not synonyms. One is paid a percentage of your balance as long as you hold it, the other a commission each time something trades. The regulator makes both hand you a disclosure form, Form CRS, precisely because the difference is invisible otherwise. Read it. It is the single cheapest thing you can do to find out which tollbooth you are standing at.
The government wage figure will not describe the people at the top. The BLS median of $102,140 is a real number for the salaried and junior end of this profession, but its 90th percentile is top-coded at "more than $239,200," which means the survey stops counting exactly where the AUM economics take over. Whenever a published average has a censored ceiling, assume the interesting money lives above the cutoff, the same measurement blind spot that hides the harbor pilots' real incomes, and the same reason a formula-set number pulls away from a wage in the COLA piece.
Related reading
- The Toll Booth: the full index: where this piece sits in the series on who collects rent on the things you cannot avoid, and every other toll alongside it.
- How insurance agents are paid: the sibling toll, collected on premiums at the sale and again on every renewal.
- How mortgage brokers are paid: a slice of the loan skimmed as the money moves from lender to borrower.
- How mortgage bond sellers are paid: the toll one layer up, where the mortgages themselves become the flow.
- How harbor pilots are paid: another job whose real incomes hide above the wage survey's ceiling.
- COLA versus the merit raise: why a number set as a percentage pulls away from one set by discretion.
Fact-check notes and sources
Wage figures come from the federal wage survey. The fee mechanics come from the SEC and FINRA. The credential requirements come from FINRA and the CFP Board. Industry fee data and firm pay grids come from named industry research and trade press, labeled as secondary. Where a figure could not be verified at a primary source, it is flagged in the text and here.
- The median wage of $102,140 ($49.11/hour) for May 2024, the $49,500 all-worker median, the 10th-percentile figure below $49,990 and the top-coded 90th percentile above $239,200, the 326,000 jobs in 2024 growing 10% to 357,200 by 2034 with about 24,100 annual openings, the 60% employed in the securities industry, and the "flat fee or commissions" description are all from the BLS Occupational Outlook Handbook, Personal Financial Advisors. This page was read through a Wayback Machine snapshot because the live bls.gov page would not open for me. A secondary aggregator cited a more recent May 2025 median near $102,203, but I could not confirm that at bls.gov, so the primary-verified figure used here is $102,140 for May 2024.
- The SEC fee example ($100,000 portfolio, 4% annual return, 20 years, with ongoing fees of 0.25%, 0.50%, and 1%) and the quoted sentence "Because of the fees you pay, you have a smaller amount invested that is earning a return" are from the SEC Investor Bulletin, How Fees and Expenses Affect Your Investment Portfolio, whose text I read through a Wayback snapshot because the live sec.gov page would not open for me. The "nearly $30,000" reduction for a 1% versus 0.25% fee is the bulletin's own chart takeaway, but the chart is an image I could not read as text; that dollar figure is reported from the SEC bulletin and investor.gov text rather than read straight off the chart, and the broader "large share of lifetime returns" phrasing is an extrapolation from the 20-year example, not a figure the SEC states.
- The graduated AUM fee schedule (median 1% up to $1 million, about 0.85% over $1 million, 0.75% over $2 million, 0.65% over $3 million, 0.50% over $5 million, and approaching 1.25% under $250,000), the all-in cost figures (about 1.85% under $250,000, 1.65% up to $1 million, 1.20% over $5 million, with product and platform costs around 0.60% to 0.70%), and the dominance of AUM as the primary pricing model are from Kitces.com research drawing on Bob Veres's Inside Information survey of about 1,000 advisors. This is industry research, not a regulator, and is labeled secondary. The specific AUM-adoption percentages sometimes quoted (around 90 percent) come from a separate Kitces pricing study, not the fee-schedule page cited here, and are not asserted as confirmed.
- The front-end sales load cap of 8.5% under FINRA Rule 2341, and the 12b-1 annual fee cap of 1.00% (0.75% distribution plus 0.25% shareholder servicing) named for Section 12b-1 of the Investment Company Act of 1940 are from FINRA's mutual-fund guidance. These caps were confirmed from FINRA rule summaries surfaced in search rather than read line by line, and actual charged loads vary widely by fund and share class, with many funds now charging far less or zero.
- The Series 65 exam (officially the NASAA Investment Advisers Law Examination, 130 questions, 180 minutes, 92 correct to pass) is from the FINRA Series 65 exam page, read at finra.org. The Series 7, Series 63, and Series 66 descriptions are from FINRA's qualification-exams index and NASAA summaries in search, and are labeled secondary.
- The adviser-versus-broker legal fork (investment advisers as fiduciaries under the Investment Advisers Act of 1940 with duties of care and loyalty per the SEC's 2019 interpretation, typically paid an ongoing asset-based fee; broker-dealers held to Regulation Best Interest, adopted June 5, 2019 with a compliance date of June 30, 2020, requiring best interest at the time of a recommendation without a continuous fiduciary duty, typically paid transaction commissions; both delivering Form CRS and advisers filing Form ADV) is drawn from the SEC Regulation Best Interest final rule, Release 34-86031 and the SEC adviser-conduct interpretation. This framing came from search summaries of the final rule rather than verbatim quotation of the primary PDF, and is labeled secondary.
- The CFP certification requirements (the four E's; a bachelor's degree in any field plus CFP Board-registered coursework; a 170-question exam over two 3-hour sessions in one day with a first-time pass rate cited around 67% for 2019; 6,000 hours of experience or 4,000 hours of apprenticeship; and the ethics commitment to "act as a fiduciary when providing financial advice to your client, always putting their best interests first") are from the CFP Board's certification process page, confirmed at cfp.net.
- The wirehouse grid figures (Merrill Lynch's 2026 standard grid running 34% to 51% on accounts above $500,000 with a reduced 20% rate on $250,000 to $500,000 households, and Morgan Stanley reported to have raised its small-household threshold to $300,000) are from trade press including AdvisorHub and InvestmentNews. The general "35 to 45 cents of every revenue dollar" take-home is a broad trade-press generalization, not a figure from the specific AdvisorHub page cited, and the Morgan Stanley 28% to 55.5% grid range that circulates elsewhere is not in the cited source, so it is not asserted here. These are firm-specific and year-specific reports, not a regulator-published schedule, they change annually and by production tier, and they sit atop deferred-comp and bonus components that are not publicly fixed; they are presented as ranges and labeled secondary.
- The three-way compensation taxonomy (fee-only via AUM, retainer, or hourly; commission-based via loads and 12b-1 trails; fee-based hybrid combining both) synthesizes the BLS, SEC, FINRA, and Kitces sources above with the SEC's investor-education explainer at investor.gov, Understanding Fees.
- Not sourced here and therefore not asserted: a text-verified exact dollar label from the SEC chart; any lifetime-percentage figure for the AUM fee's total drag; a fixed or regulator-published wirehouse grid schedule; and specific commission percentages on annuities, insurance-linked products, and non-traded REITs, which vary widely and are often not publicly fixed.
This post is informational and journalistic, not career, legal, or financial advice. It describes federal wage data, SEC and FINRA materials, CFP Board requirements, published industry research, and trade-press reporting. Fee schedules, pay grids, exam formats, and regulations change, and several figures are as of 2019 through 2026 as noted, so verify current status before relying on any of them, and consult a licensed professional before making any financial decision. Mentions of specific firms, exams, and organizations are nominative fair use, and no affiliation is implied.
